(Originally published on Zacks.com)
Opponents of this recent bull market will say that volume isn’t as strong as in past rallies and therefore the current trend is weak and unstable. I found some interesting statistics and trends that might not only negate this theory, but give us a better understanding of who is actually driving these markets. You’ll see that things are not what they may seem when it comes to current volume.
Perhaps more importantly we will explore who’s money is moving into and out of the marketplace to really prove if current volume is truly weak and if the trend is even affected by “low volume” at all.
Volume is the cause and price is the effect
Think of volume as a river’s current flowing into or out of a stock or the stock market as a whole. If the current is strong in one direction, it can move prices quickly; if currents are opposing then the water (stock) may not move at all.
Volume is created by transactions; when market takers (you, me and other investors) initiate an order to buy or sell, the “market makers” (liquidity providers) or other investors take the other side.
Nothing happens to a stock price until a trade is made. In other words, someone actually has to pay more for shares to truly rise in value and vice versa to the downside. Sometimes market makers will make a trade, raise the price and see if anyone pays it. If anyone is willing to pay the ask, the higher the stock price goes. They may do this for some time until someone comes and sells it back down.
Stocks rising on little or no volume (relative to the average) can be an indication of market makers taking advantage of investors. The reality is that this is not manipulation, just a trader trying to make extra cash by selling higher and higher and a couple suckers willing to pay it. Dramatically diminishing volume in a short term up-trend might be a signal that there are less buyers at the moment, but it DOESN’T necessarily mean that the trend can’t continue after a short break.
Also keep in mind that heavily traded and popular stocks have a ton of participants that help keep prices in check. Technical analysis (which almost always includes volume) and funds with computerized algorithms plays a huge role in keeping stocks from getting too disconnected from the market. Since stock prices are mostly subjective, traders use objective measurements like P/E, growth and technical readings such as ATR (average true range), moving averages, Bollinger Bands and more to make sure a stock doesn’t get too far out of line.
The point here is that with so many eyeballs looking at stocks, abnormal price movements are being monitored whether the volume is high or low and if the stock is undeserving of its current value, markets generally do something about it in short order.
Recognize the trends
Reading volume properly and understanding how to compare and contrast them to one another can be like getting a “free look” into the psyche of the market participants.
Just like water building up behind a damn, high levels of volume pouring into a stock can cause an explosion of price movement. If you can spot the tsunami before it hits the shore or identify an undertow you can exploit this underutilized indicator.
Analyzing volume trends will help you see the real trend and determine if a certain movement in a stock is going to be carried through or quickly reversed. When you combine volume with fundamental analysis like the Zacks Rank and a quick glance at the techincals, your conviction and thesis will be that much stronger. Sometimes a quality stock, trading at lower volume levels could just mean that it’s either temporarily out of favor or undiscovered; not a poor stock or weak trend.
Obviously volume trends are important to the downside as well, but generally volume tends to be higher when stocks are dropping because of the effects of fear and panic, so you must account for this and realize that volume will almost ALWAYS be higher in a bear market compared to a bull market. Use past history (10 period averages help as well) to give you a sense of normal volume, but don’t go back too far and be sure that you correlate news and economic events with high or low volume periods to normalize the data.
Volume isn’t a cinch to read and big volume spikes with a huge move in a stock aren’t necessarily good things either. Remember that a rising tide on an ocean beach doesn’t just flood in, it is a series of ebbs and flows that gradually move the water up the beach.
There are some traders who simply “read the tape” and make the bulk of their trades using volume trends only.
Current Trends
Average daily volume on the nation’s equities markets is down from 9.75 billion shares in 2009 to 6.45 billion shares in 2012. Markets were also in free-fall back in 2009 causing volume to surge.
Volume trends have also become a bit clouded with the introduction of HFT (High Frequency Trading) which is basically bogus volume that is occurring in large quantities between normal trades and prices. HFT algorithms not only generate tremendous profits but they may also exacerbate price and volume movements.
According to Rosenblatt Securities, High-frequency trading accounted for 66% of equities trading in 2009, now that number is down to 50%.
Program trading, which has been around a bit longer than HFT and is a little more accounts for roughly 30% of total NYSE volume, it is also down substantially.
Program and HFT trading both are more prevalent and profitable in volatile markets, which is not the current environment. In fact, volatility has dropped substantially. Between 2008-2011 the VIX averaged close to 26%. In that same time frame, the average trading range of the S&P 500 was $108 per month during that time with the average price of the index closer to a 1000. This meant that the S&P was moving over 10% per month on average!
Over the last year, the S&P’s monthly ATR has dropped below $80 with the index at an average price around 1,400. Volatility has been practically cut in half, with the S&P now moving at just 5.6% per month and the VIX at 11%.
But this is not necessarily a bad thing. Without the headlines, panic and stress, traders can take more time to think about their trades and be less reactive to the markets. Lower volatility in the markets mean less trading by humans and less exploitation from computers and I don’t know about you, but I am happy to see us returning to more normal volume levels.
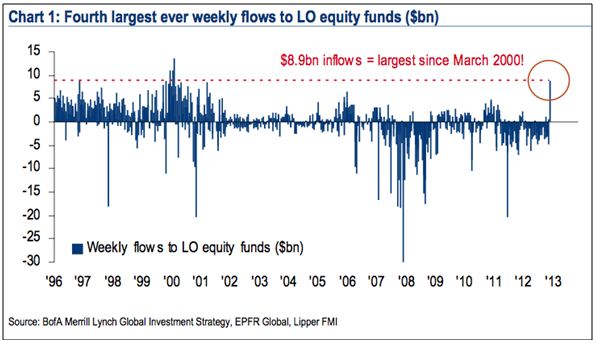
It’s not that investors have gone away. In fact, equity funds just recently saw the largest weekly inflows in history.
Look at how fund flows have been negative for 2011 and 2012, sure volume was a little higher…but is that the volume you want to see?
Volume doesn’t have to be high to make money. In fact, trends can sustain without extreme volume and stable tends do best when volume is consistent. While volume does create stock prices, volatility is the genesis of higher volume.
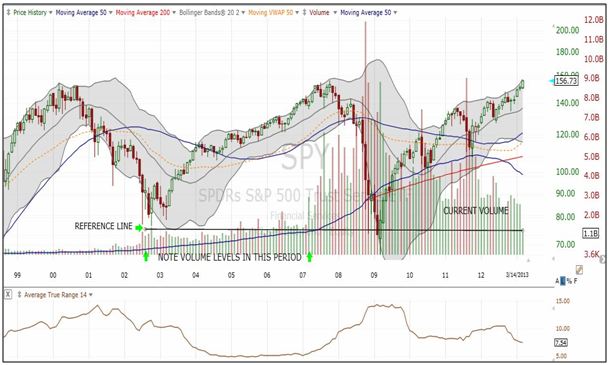
From 2003-2007 the S&P 500 gained roughly 75% from low to high. In that time, volume in the SPY (Spiders S&P 500 ETF chart below) averaged a little over 900 million shares per month. Today, even with the decline in volume, the average is close to 3 Billion shares traded per month.
In my eyes, I don’t see extremely low volume at all, just a return to normalcy from an unprecedented moment in history.
If markets could add 75% from their lows of 2002 on a 1/3rd of the volume why can’t we add value now?
Everything is relative, and just because people are comparing current volume to the mania that ensued in 2009 that doesn’t make them correct.
Also keep in mind that volume may shift from exchange to exchange and security to security. Dark pools of liquidity are also soaking up a good portion of the large volume trades that don’t get reported in normal tallies.
Options volume on the rise
As a professional options trader, I can honestly tell you that the option markets are where smart money goes to play. If a whale wants to make a trade (quietly and efficiently, he’ll do so with a bog option trade.
The increasingly savvy investment public is turning to options more and more to get their trades done or hedge their existing positions.
Think about this; roughly 4 billion equity options were traded in 2012, pepper in index options and futures and that number jumps to over 25 billion.
Even if we just look at the 4 billion, that’s the equivalent of 400 billion shares of stock (1 option generally controls 100 shares of stock) that are not being fully accounted for in volume tallies and mostly in the bigger, more expensive names like Google, Apple, Priceline and the like.
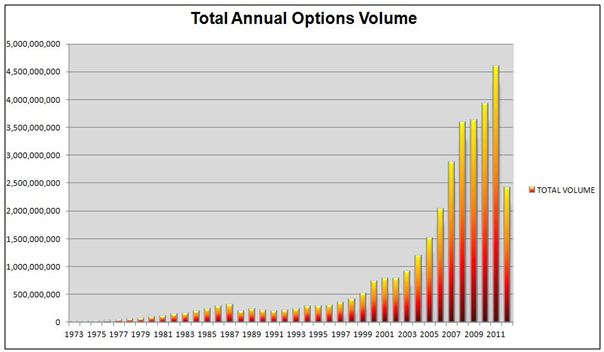
Source : The Bloomberg Visual Guide to Options
What does it all mean?
The reality is that when you look at the long term trends, volume is actually on the rise. Sure volume has come in since the panic of 2009, but that was not a “normal” period to reference Don’t be misled by those who say that volume is low because all it takes it more buyers than sellers to make prices rise.
While volume anomalies should be noted and can be a sign of trouble, make sure you know exactly what is being measured. Big volume changes in a daily context can be used for strength and weakness in a short term trend, but don’t get hung up on it.
The market’s move higher tells me that there are more buyers than sellers, period. Even with the option markets and dark pools soaking up some of our volume, we are still trading 300% of the avearge volume between 2002 and 2007.
I think that is plenty to allow markets to move higher from here.
If anything, the technicals and fundamentals will guide us to the next level. For now, that level will most likely be higher after a short pause.
Jared A Levy is one of the most highly sought after traders in the world and a former member of three major stock exchanges. That is why you will frequently see him appear on Fox Business, CNBC and Bloomberg providing his timely insights to other investors. He has written and published two tomes, “Your Options Handbook” and “The Bloomberg Visual Guide to Options”. You can discover more of his insights and recommendations through his two portfolio recommendation services:
Zacks Whisper Trader– Learn to buy stocks likely to have robust earnings BEFORE they report.
Zacks TAZR Trader – Technical Analysis + Zacks Rank. Best of both worlds approach to find timely trades.
Follow Jared A Levy on twitter at @jaredalevy
Like Jared A Levy on Facebook


