While most homebuilders like Toll Brothers ( TOL – Snapshot Report ) and Lennar ( LEN –Analyst Report ) have been bidding up ahead of their numbers and are trading at relatively high valuations, companies like Flagstar ( FBC – Snapshot Report ) are relatively inexpensive on a valuation basis and have seen their share prices cut by over a third.
The nice think about the mortgage play is that you don’t have to worry if customers are buying new or old homes or what the cost of lumber or land is. They simply profit from the transactions, no matter who’s buying; as long as the buyer secures a mortgage of course.
Local Bank with National Exposure
Even though all of Flagstar’s physical branches are in the state of Michigan (They are the largest banking company headquartered in the state), Flagstar has assets of $14.1 billion and along with traditional services, is one of the top-tier mortgage originators in the country and one of the nation’s top 15 largest savings banks.
During the last housing boom, Flagstar was one of the top lenders amidst a circle of many who didn’t live to see the revival of the space. Flagstar not only emerged from the great recession (with a few bumps and bruises), but has remained a strong player in the mortgage origination space.
Healthy Housing
The fact that the average home price is somewhere around were it was back in 2004 should be enough to get people interested in buying a home. Add in record low interest rates, high rents and a stabilizing job market and you have a recipe for stable housing growth and price expansion.
The Case-Shiller 20 city home price index (not seasonally adjusted) is up over 2% since March of 2011 and 8% over the last 12 months. Over the past year we have seen new and existing home sales on the rise in conjunction with prices, which is an encouraging sign.
At the same time, average rent rates have increased over 5% annually (much more in dense urban areas) adding to the home ownership push.
Interest rates should remain low for the medium term, but the specter of an interest rate rise may also nudge those on the fence to lock in that mortgage and buy a home. An expanded government refinance program has boosted refinance volumes while fresh mortgage originations are starting to slowly creep higher. Banks like Flagstar are also adding profits from gain-on-sale margins, essentially profits they earn on selling refinanced loans to investors.
For the next several months, I would expect Flagstar and other quality banks and lenders to prosper from an improving housing market in addition to their traditional banking revenues.
While it may be true that mortgage originations may slow in 2013, I believe that markets have adjusted the price of FBC in anticipation of a slower financial sector, giving it a 35% haircut from its highs of the year. This is extreme when you compare the stock to many of its peers.
The Charts
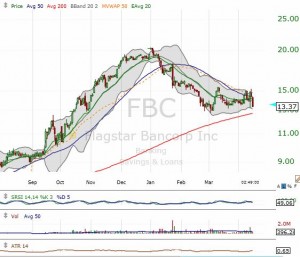
While the stock’s fundamentals seem sound, the shares have been pummeled over the last 5 months, and got slapped with a 6% correction just yesterday. The selloff started and accelerated with a break below the 50 day moving average back on January 11th.
Shares have remained below the 50 day average up until about a week ago, when the stock made an attempt to breakout above it, but was shunned by broad market weakness. The recent action has been volatile, but shares remain above their 200 day moving average, currently at $12.73.
$13.00 should also be support here and a move down to that level would put Flagstar in deep over-sold territory and maybe trigger a bounce. To the upside, I would look for a recovery to the next resistance level right around $15.30 and then evaluate an exit if momentum is fading.
Moving Forward
Earnings are due out April 23rd and while it carries a Zacks Rank of 1, the ESP is flat for the stock as it approaches earnings. This means there is some added risk coming into the report, but being that analyst coverage is minimal; it’s hard to tell just how bullish or bearish the pros are going into the report.
Flagstar has managed to beat the Zacks Consensus 4 of the last 4 quarters with an average beat of over 377% (Q3 2012 they reported $1.40 versus consensus for $0.10).
There is no doubt that Flagstar carries added risk and volatility with an average daily trading range that’s 5% of its stock price. If you are looking for a more tame mortgage/banking play here in the States, check out Wells Fargo ( WFC – Analyst Report ) , it trades at just 10 times earnings and recently posted a 22 percent increase in first-quarter profit on April 12th. Wells Fargo is the nation’s largest home lender and they continued to capture record gains even while mortgage revenue slowed.
Flagstar does look intersting here, if you have the risk appetite for it!
Jared A Levy is one of the most highly sought after traders in the world and a former member of three major stock exchanges. That is why you will frequently see him appear on Fox Business, CNBC and Bloomberg providing his timely insights to other investors. He has written and published two tomes, “Your Options Handbook” and “The Bloomberg Visual Guide to Options”. You can discover more of his insights and recommendations through his two portfolio recommendation services:
Zacks Whisper Trader– Learn to buy stocks likely to have robust earnings BEFORE they report.
Zacks TAZR Trader – Technical Analysis + Zacks Rank. Best of both worlds approach to find timely trades.
Follow Jared A Levyon twitter at @jaredalevy
Like Jared A Levyon Facebook
